

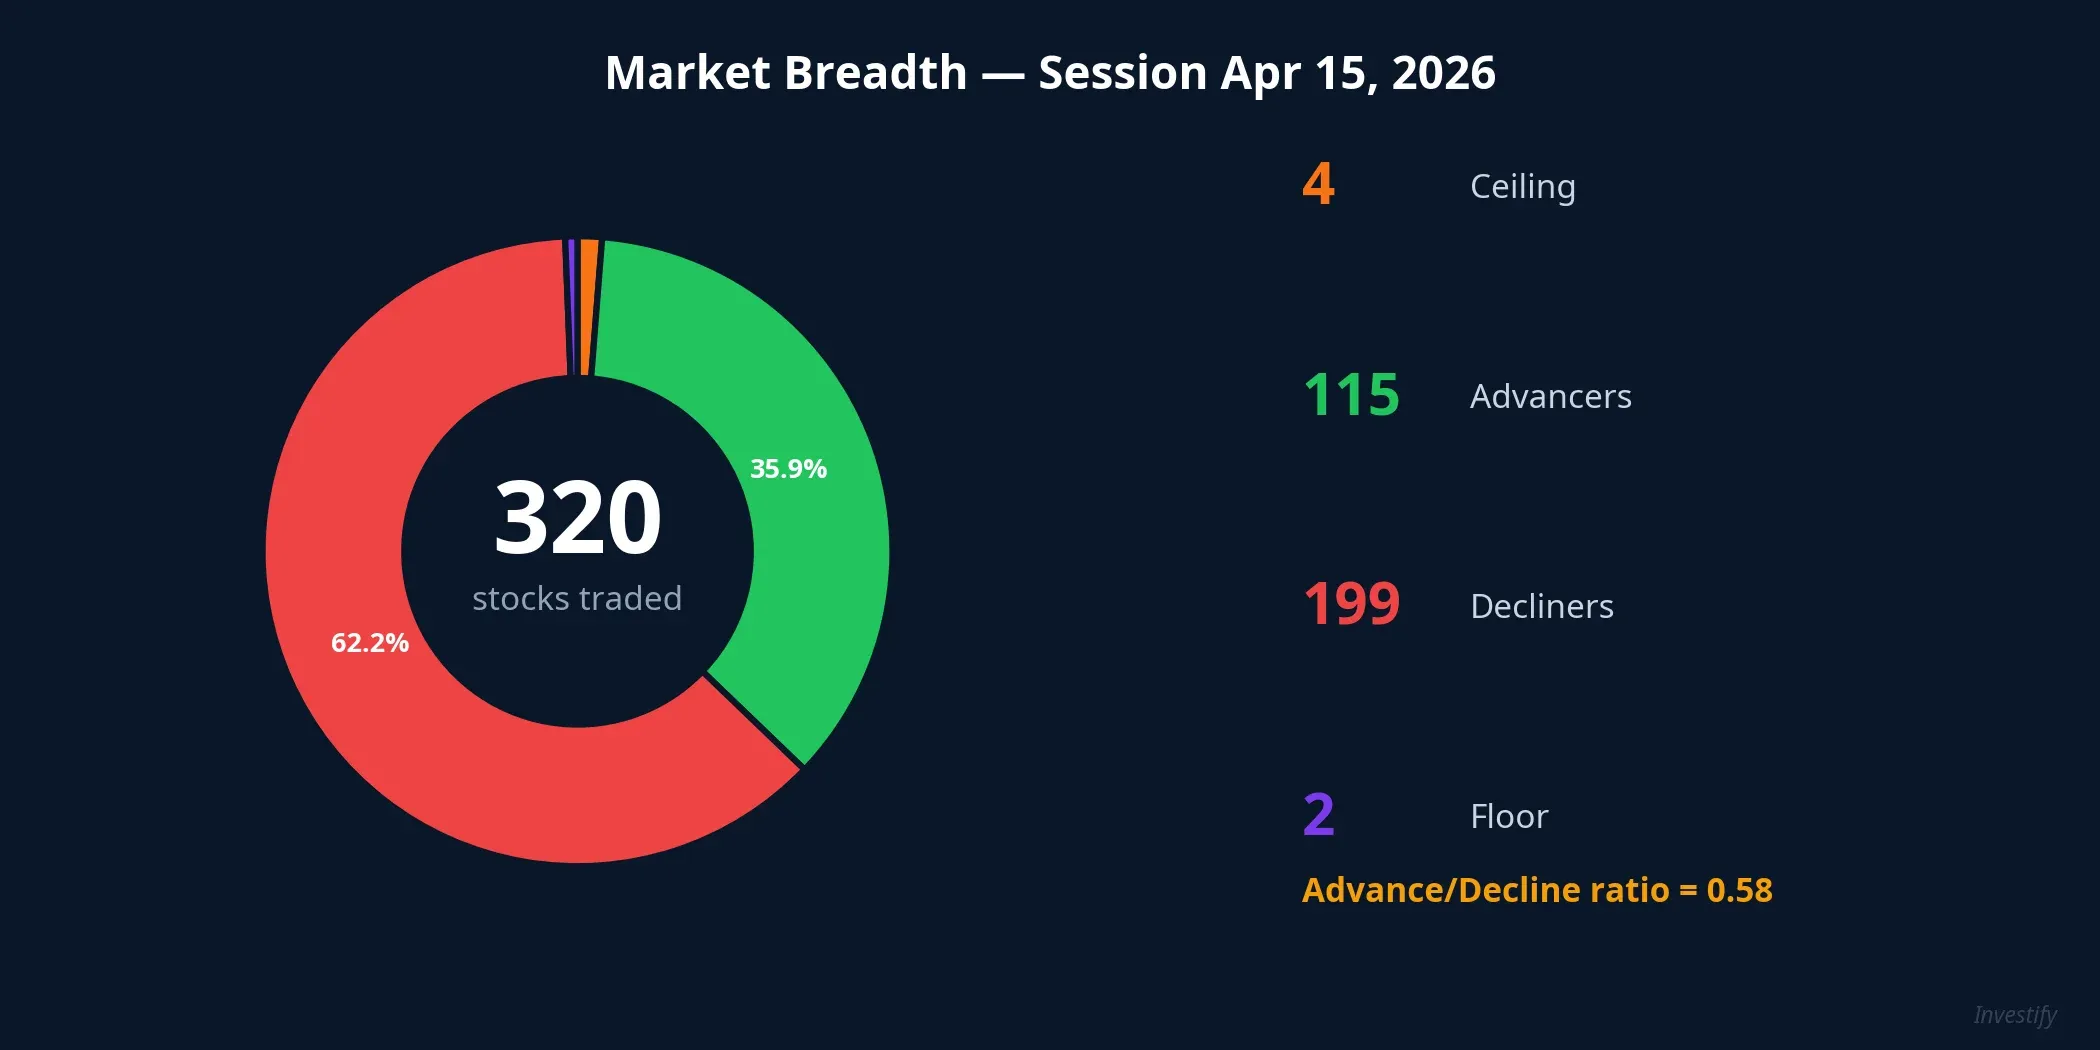
VN-Index closed the April 15 session at 1,800.65 points, up 25 points (+1.41%), officially reclaiming the psychological 1,800 mark. Trading volume reached 948.7 million shares, signaling significant capital flow. But beneath that impressive headline lies a different reality: only 115 stocks advanced while 199 declined. For every 10 stocks on HOSE, roughly 6.3 ended the session in red.
Put simply: if you did not hold the right leading stocks, your portfolio very likely declined on a day the index gained over 1.4%. This article will help you understand the mechanism behind that paradox through three layers of data.
Layer 1: VIC and VHM drove the entire gain
The answer to “who pulled the index?” lies in two names: VIC (Vingroup) and VHM (Vinhomes).
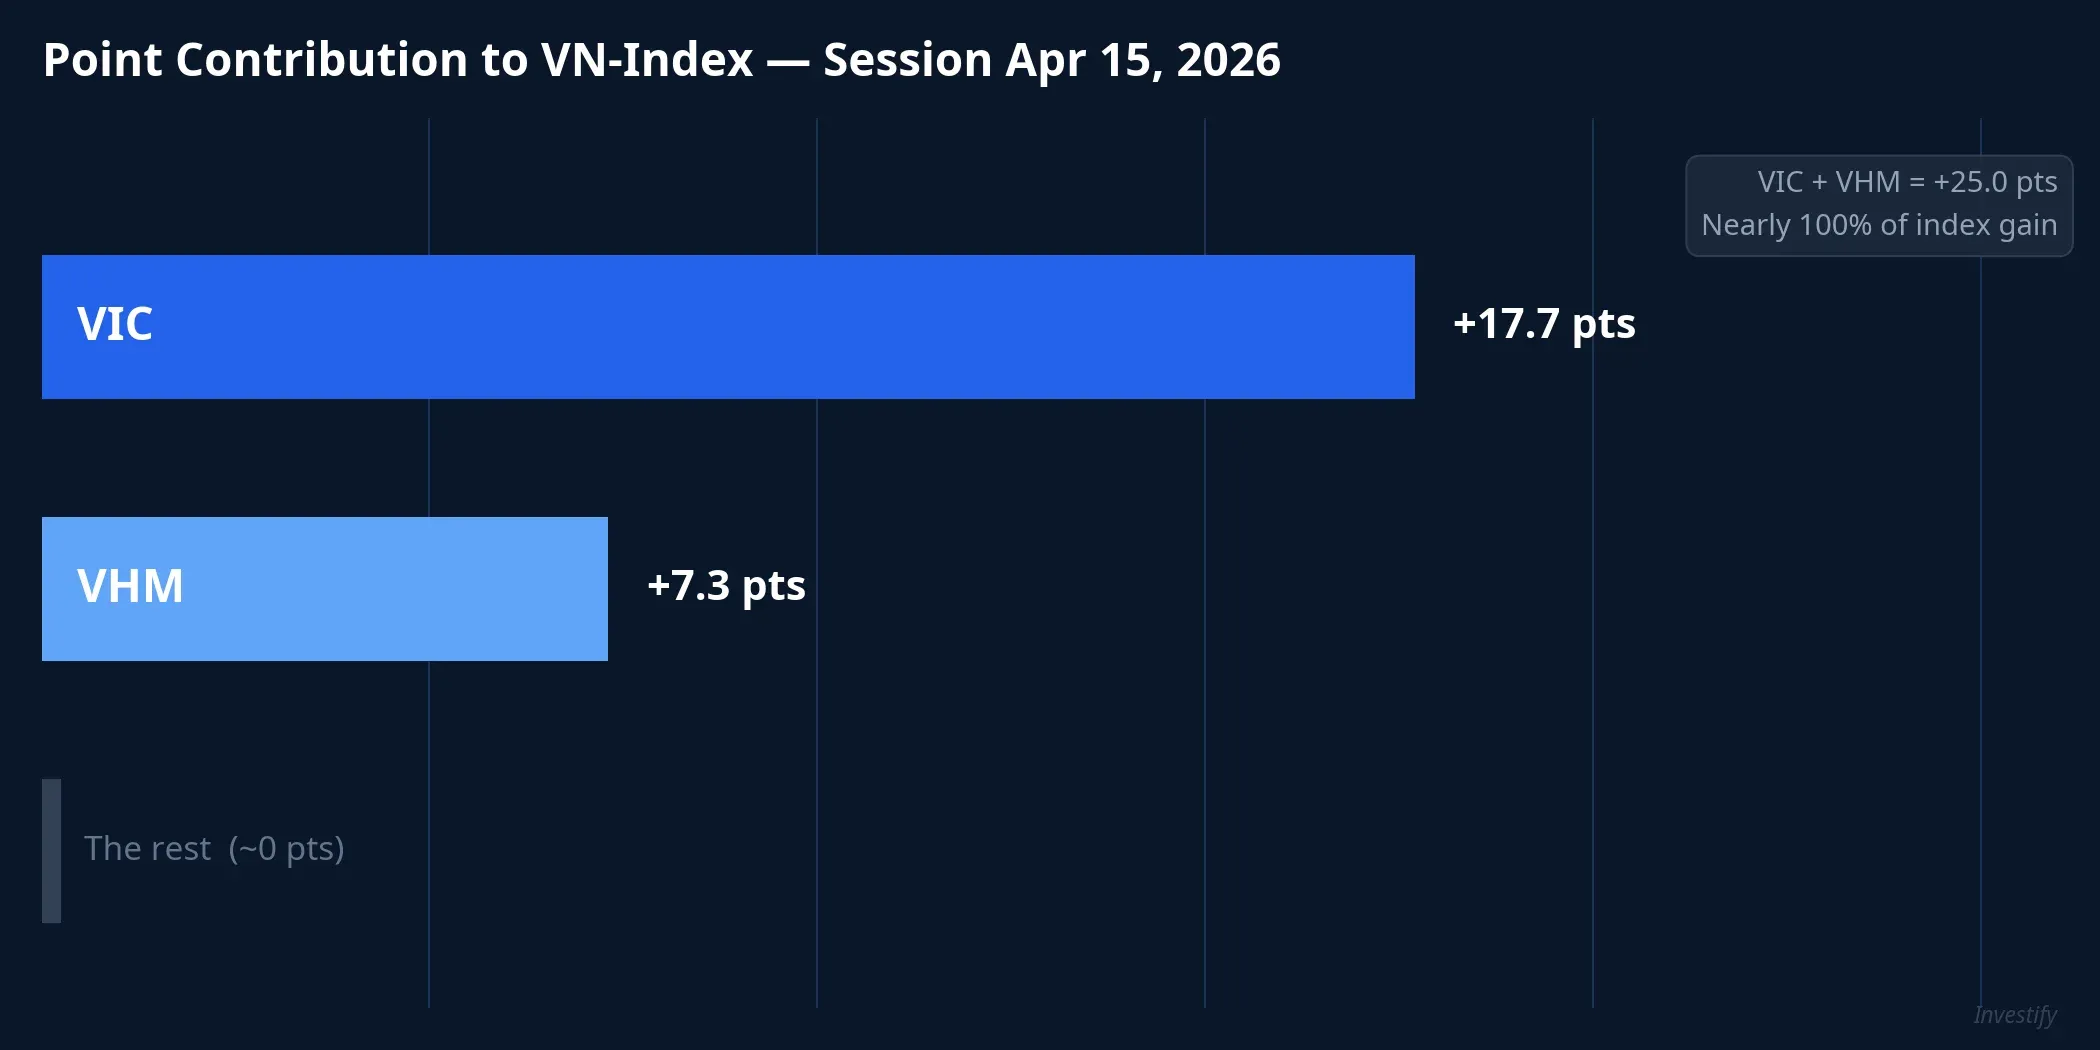
VIC closed at VND 177,000, up VND 11,500 (+6.95%) on volume of 6.64 million shares, nearly 3 times its 5-session average. VIC’s market cap reached VND 1,364 trillion, making it the largest stock on HOSE. VHM closed at VND 137,000, up VND 8,100 (+6.28%) on volume of 6.59 million shares, with a market cap of approximately VND 562.7 trillion.
Based on market-cap and free-float weighting calculations, VIC contributed approximately 17.7 points and VHM approximately 7.3 points to VN-Index during this session. Combined, that is approximately 25 points, equivalent to nearly 100% of the index’s total gain. Strip out VIC and VHM, and VN-Index was essentially flat or slightly negative.
This rally was not a one-session event. Over the 4 trading sessions from April 9 to 15, VIC climbed from VND 149,200 to VND 177,000 (+18.6%) and VHM rose from VND 122,000 to VND 137,000 (+12.3%). The sustained buying streak suggests significant capital flowing into the Vingroup cluster.
Layer 2: Deep sector divergence
Looking at the broader picture, only 3 out of 11 sectors gained on April 15. Real estate led with a 5.38% gain, driven primarily by VIC, VHM, and VRE (+5.02%). Industrials rose 1.06% and Consumer Discretionary gained 1.04%.
On the flip side, all 8 remaining sectors declined. Media dropped the most (-2.20%), followed by IT (-1.39%) with FPT falling 1.44% to VND 75,100. Banking fell 0.82%, with STB down 2.72% and MWG down 1.96%. VCB (Vietcombank) was one of the few bank stocks to stay green, up a modest 1.01% to VND 59,900, but this was not enough to offset the sector-wide weakness.
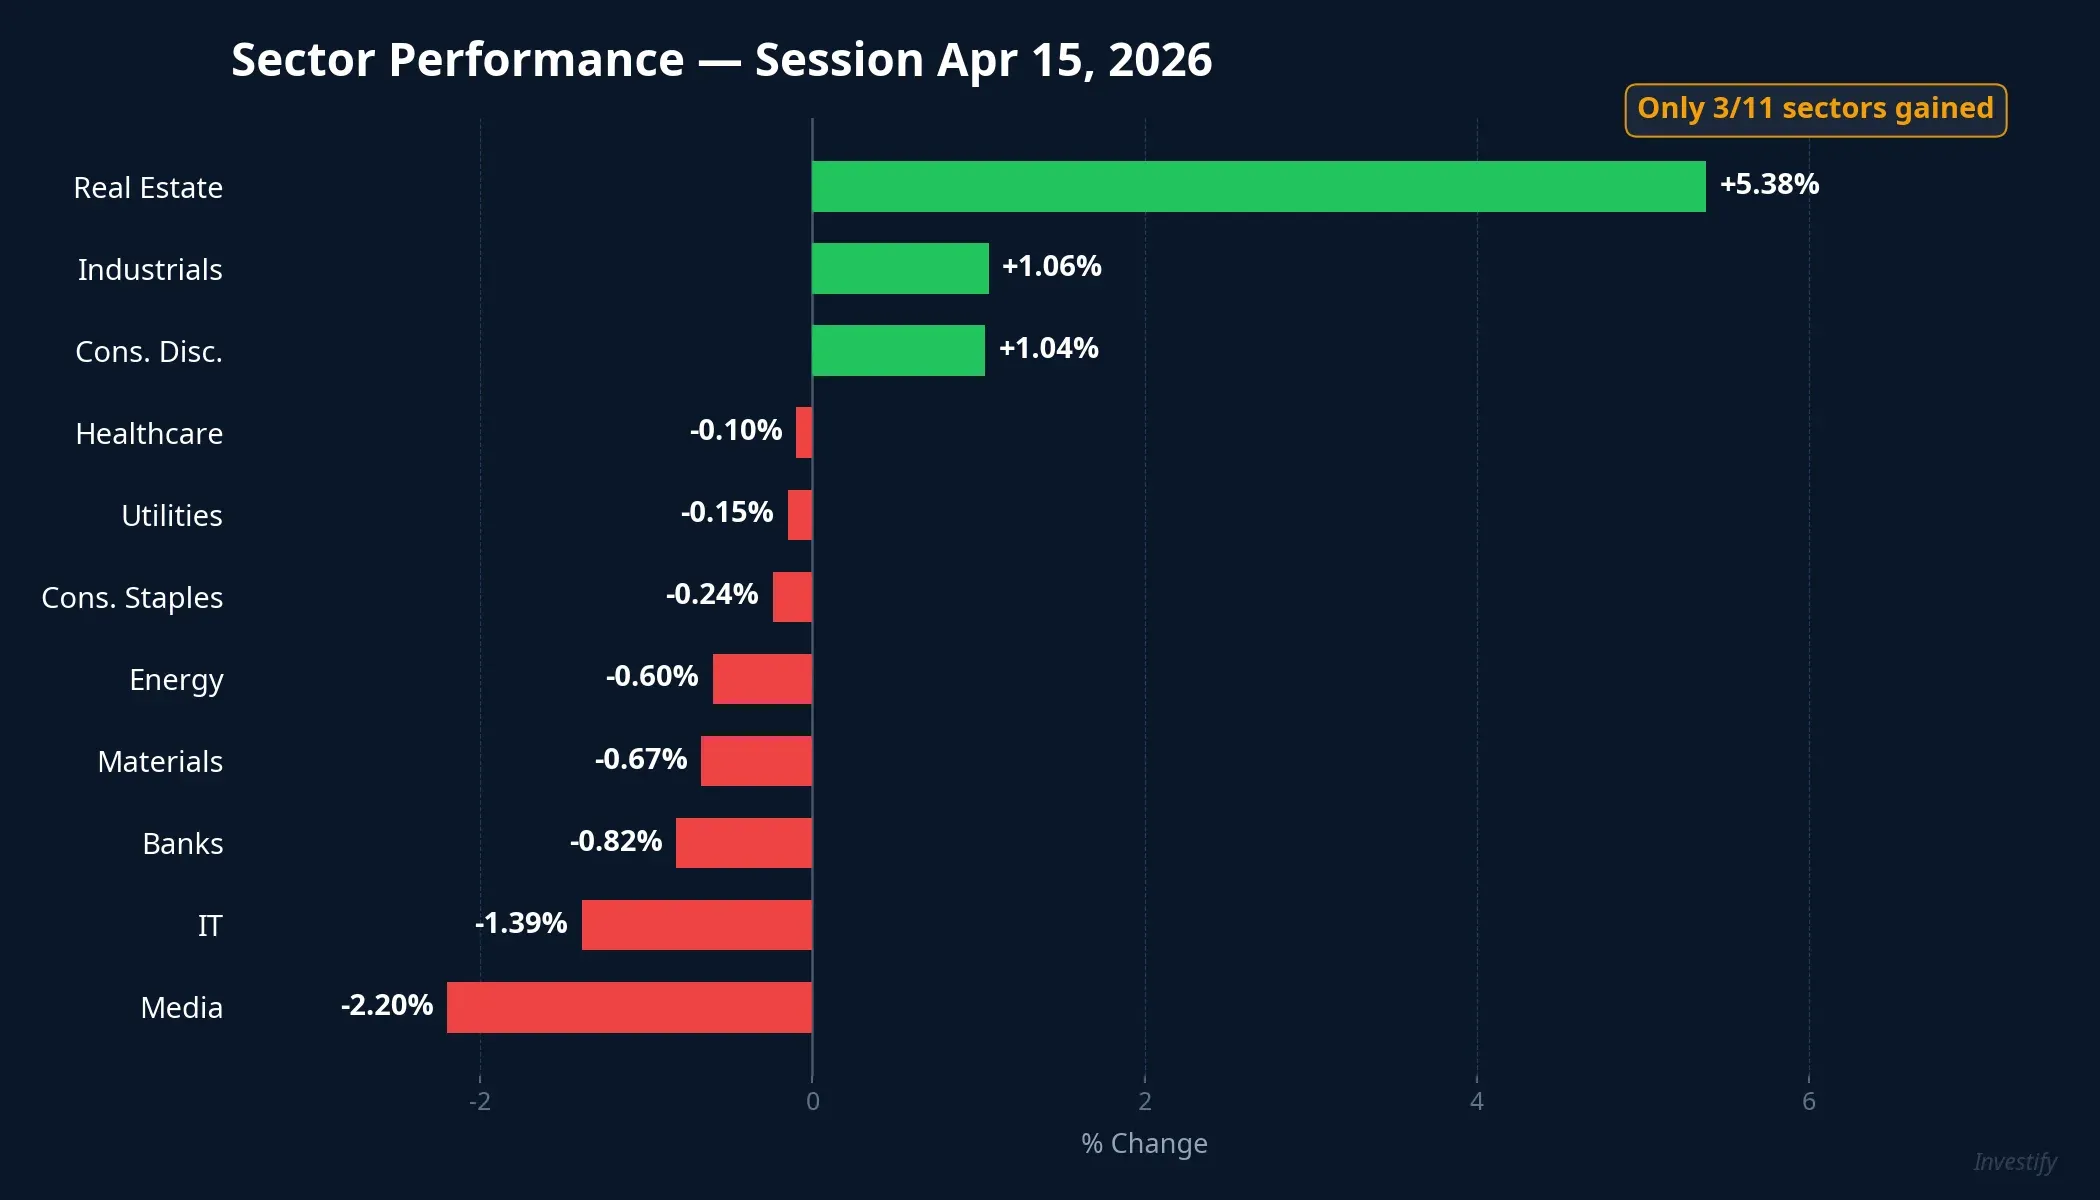
This picture shows capital was not rotating broadly but concentrating heavily into large-cap real estate names. When only 3 of 11 sectors advance, the index’s rally lacks broad-based support.
Layer 3: Foreign investors sold into the rally
A notable data point: foreign investors were net sellers of over VND 1,100 billion on April 15, with VHM and VIC among the most heavily sold names.DNSE
This creates a paradox: VIC and VHM were the session’s biggest gainers but were simultaneously among the most net-sold by foreign capital. Domestic buying was the primary force driving these two stocks higher. The buyers may have been proprietary desks at securities firms or large retail investors, though detailed data to identify precise contribution weights is not yet available.
Foreign net selling during a strong index rally signals that offshore capital does not share the bullish conviction, adding a layer of risk to the sustainability of the short-term trend.
The mechanism: why VN-Index can mislead perception
Here is how it works: VN-Index is calculated using a free-float adjusted market capitalization method. Each stock carries a different weight based on its market cap multiplied by its free-float ratio.
With a market cap of VND 1,364 trillion, VIC commands a massive weight in the index. When VIC rises nearly 7%, its impact on the index equals dozens of mid-cap stocks hitting their ceiling prices. Conversely, hundreds of small and mid-cap stocks falling 1-3% barely register on the index.
What does this mean for your portfolio? If your holdings are concentrated in mid-cap and small-cap stocks, a “bright green” VN-Index session could actually be a day your portfolio declines. This is not a flaw in the index; it is by design: VN-Index reflects the health of mega-caps, not the health of the entire market.
Breadth divergence: what does history say?
Data from 2016-2026 records approximately 15 sessions with a similar pattern: significant index gains but declining stocks outnumbering advancers. The aftermath was not uniform. In some cases, the market continued to rise as capital eventually rotated into other groups within 5-10 sessions. In other cases, when the lifting effect from leading stocks weakened, the index corrected in the short term.
The deciding factor was typically whether capital flowed into mid-cap and small-cap stocks in subsequent sessions. If the advance/decline ratio returns above 1.0, the rally has a foundation. If breadth remains negative while the index rises, the risk of correction increases meaningfully.
Three signals to watch
The April 15 session raises important questions for the sessions ahead, and three factors are worth monitoring in the coming week.
First, VIC has gained 18.6% in just 4 sessions, a very rapid pace. Short-term profit-taking pressure is an active risk. If VIC and VHM cool off before capital rotates to other groups, VN-Index could lose its anchor.
Second, banking carries the second-largest weight in VN-Index. If banks continue to decline, pressure on the index will mount the moment real estate cools down.
Third, the 115/199 ratio represents one of the widest breadth divergences in recent sessions where the index gained more than 1%. A sustainable rally requires breadth of at least 1.0, meaning more stocks advancing than declining.
The Q1/2026 earnings season will be the key test of whether this price rally is supported by real profit growth or is merely a short-term capital flow effect. This is the most important signal to watch over the next 2-3 weeks.