
VN-Index just had a solid month: +7.5% through April 16, closing above 1,819 points. But placed alongside Nikkei 225 (+16.4%) and KOSPI (+10.4%), the performance gap widens to 3-9 percentage points. All three markets benefited from the same regional risk-on sentiment driven by U.S.-Iran negotiation hopes. So why did Vietnam lag the rest of Northeast Asia? The three layers below show the answer lies in market structure, not sentiment.
Regional snapshot: same risk-on, different magnitudes
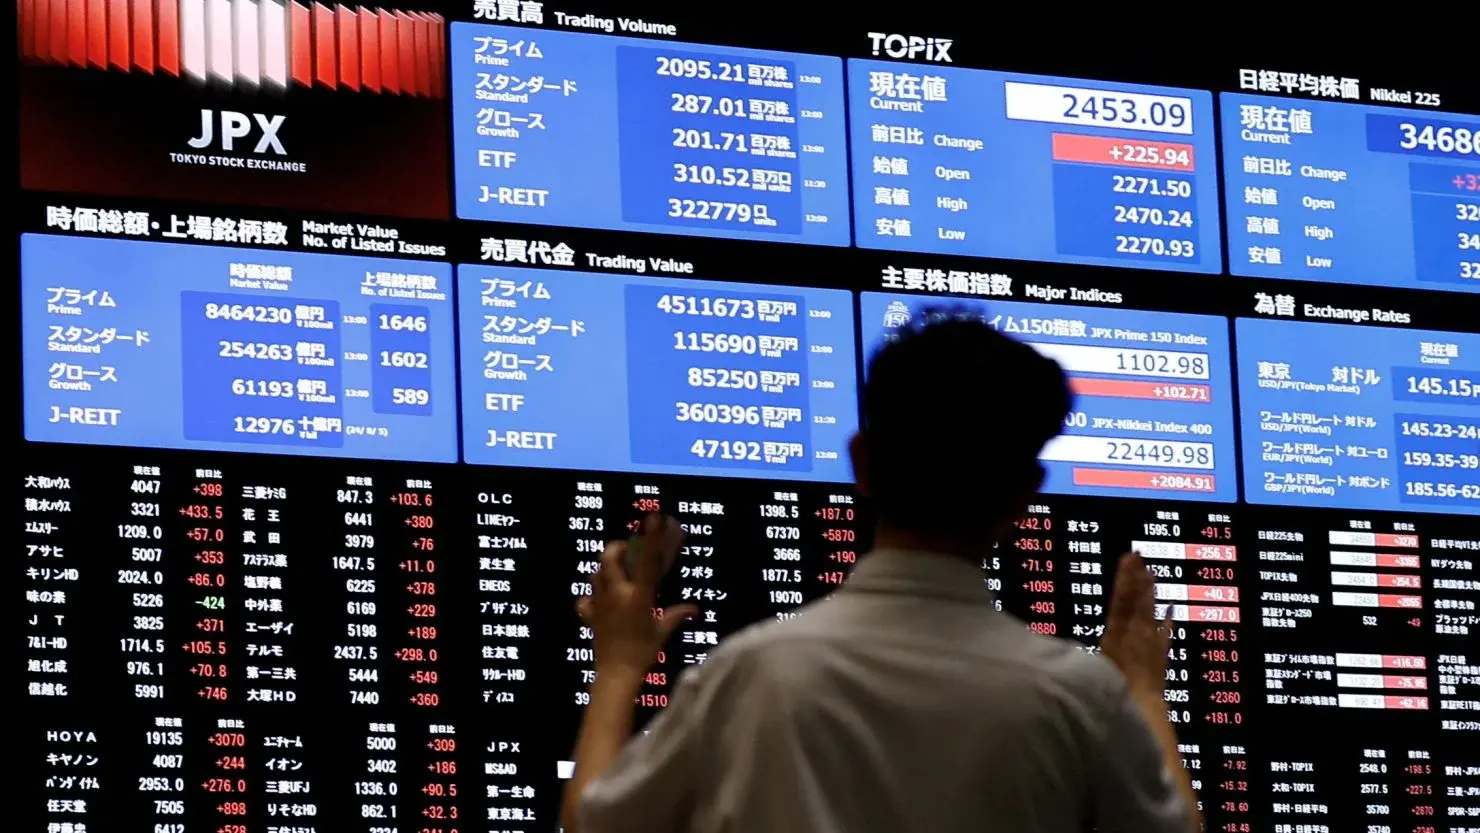
On April 16, VN-Index closed at 1,819.83 points (+1.07%).TradingEconomics On the same day, Nikkei 225 set a new all-time high at 59,575 points, surpassing the previous record close of 58,850 from February 27.TradingKey South Korea’s KOSPI reached 6,226 points, boosted by SK Hynix hitting a record high and Samsung Electronics surging strongly.Seoul Economic Daily
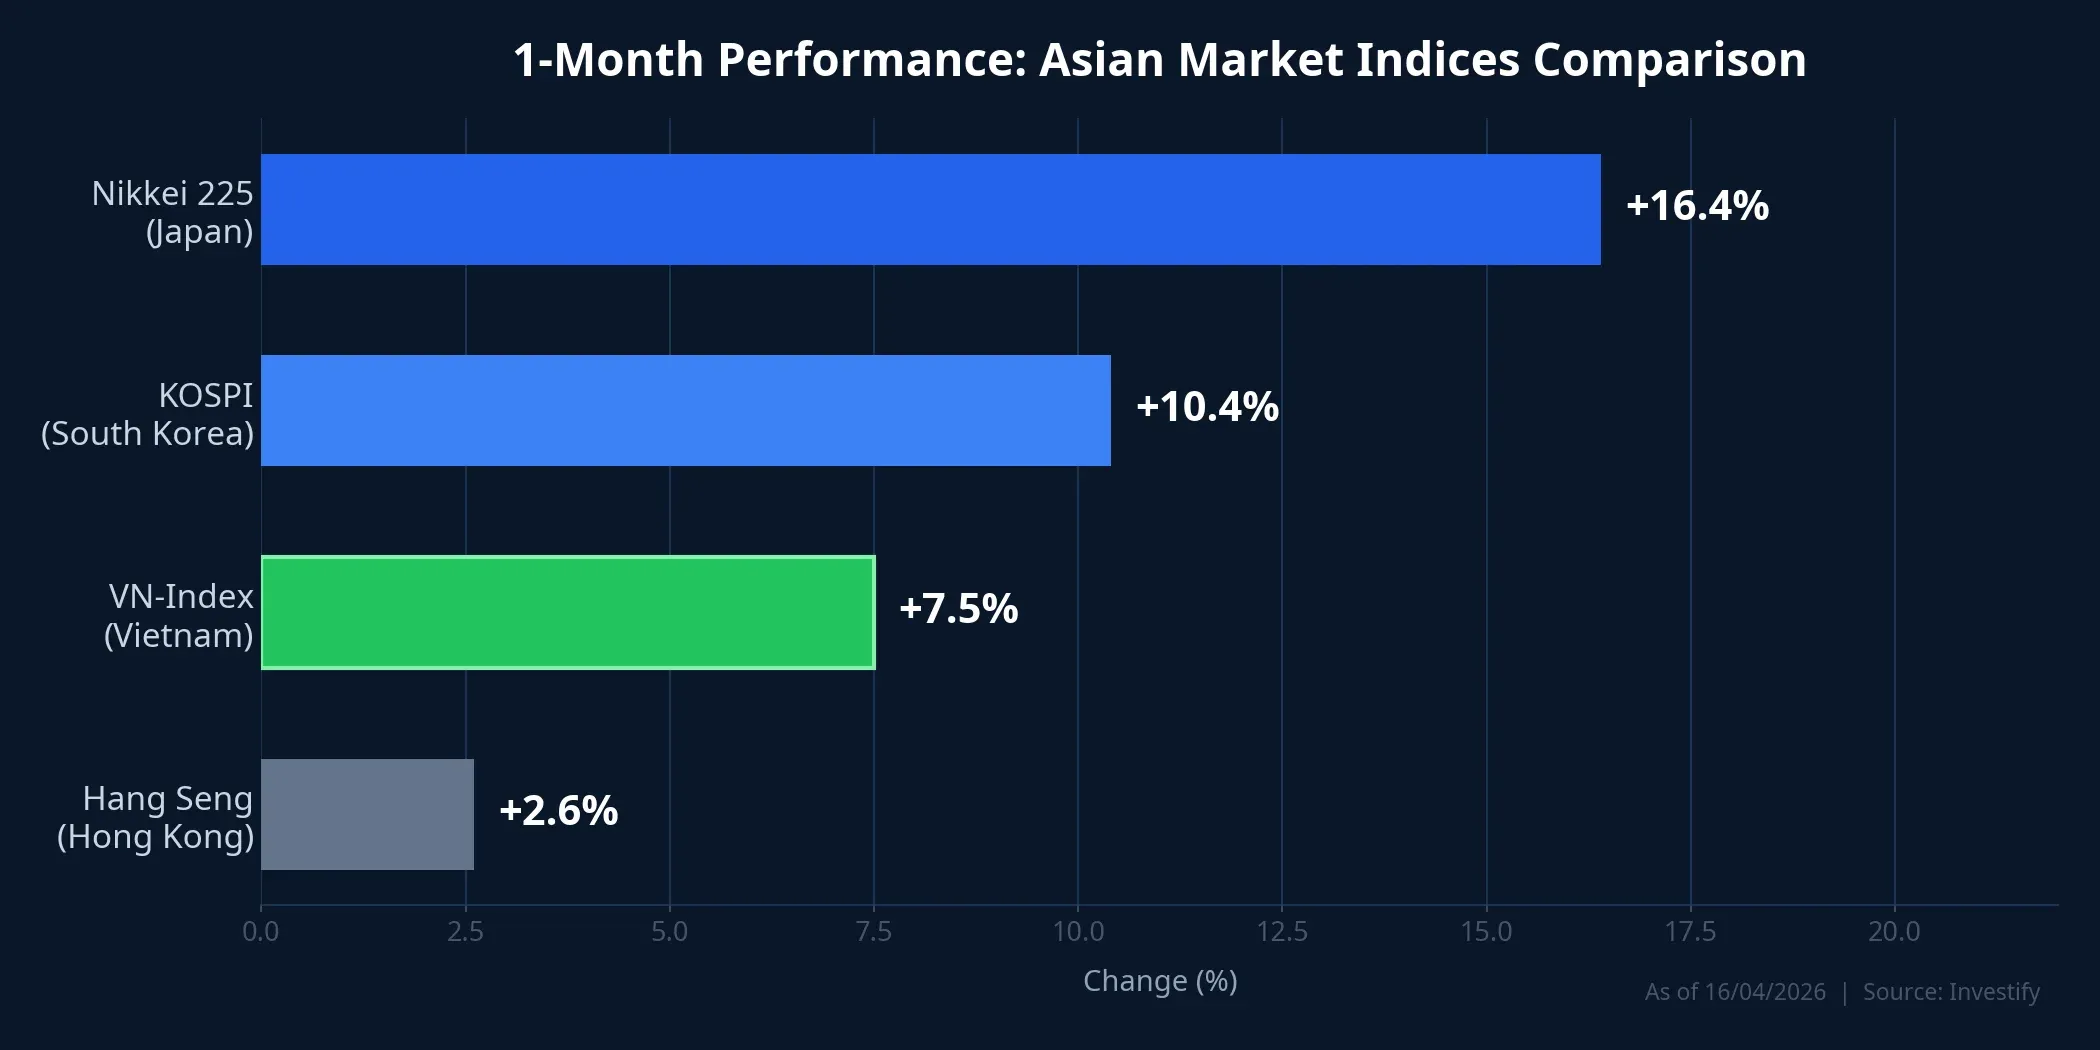
Looking at the trailing one-month performance through April 16:
| Index | Close (Apr 16) | 1-Month | YTD |
|---|---|---|---|
| Nikkei 225 | 59,575 pts | +16.4% | +16.4% |
| KOSPI | 6,226 pts | +10.4% | +44.5% |
| VN-Index | 1,819 pts | +7.5% | +1.8% |
| Hang Seng | 26,394 pts | +2.6% | ~0% |
A 7.5% gain is respectable in isolation. However, the 3-9 percentage point gap versus the two Northeast Asian markets raises structural questions that the three layers below will address.
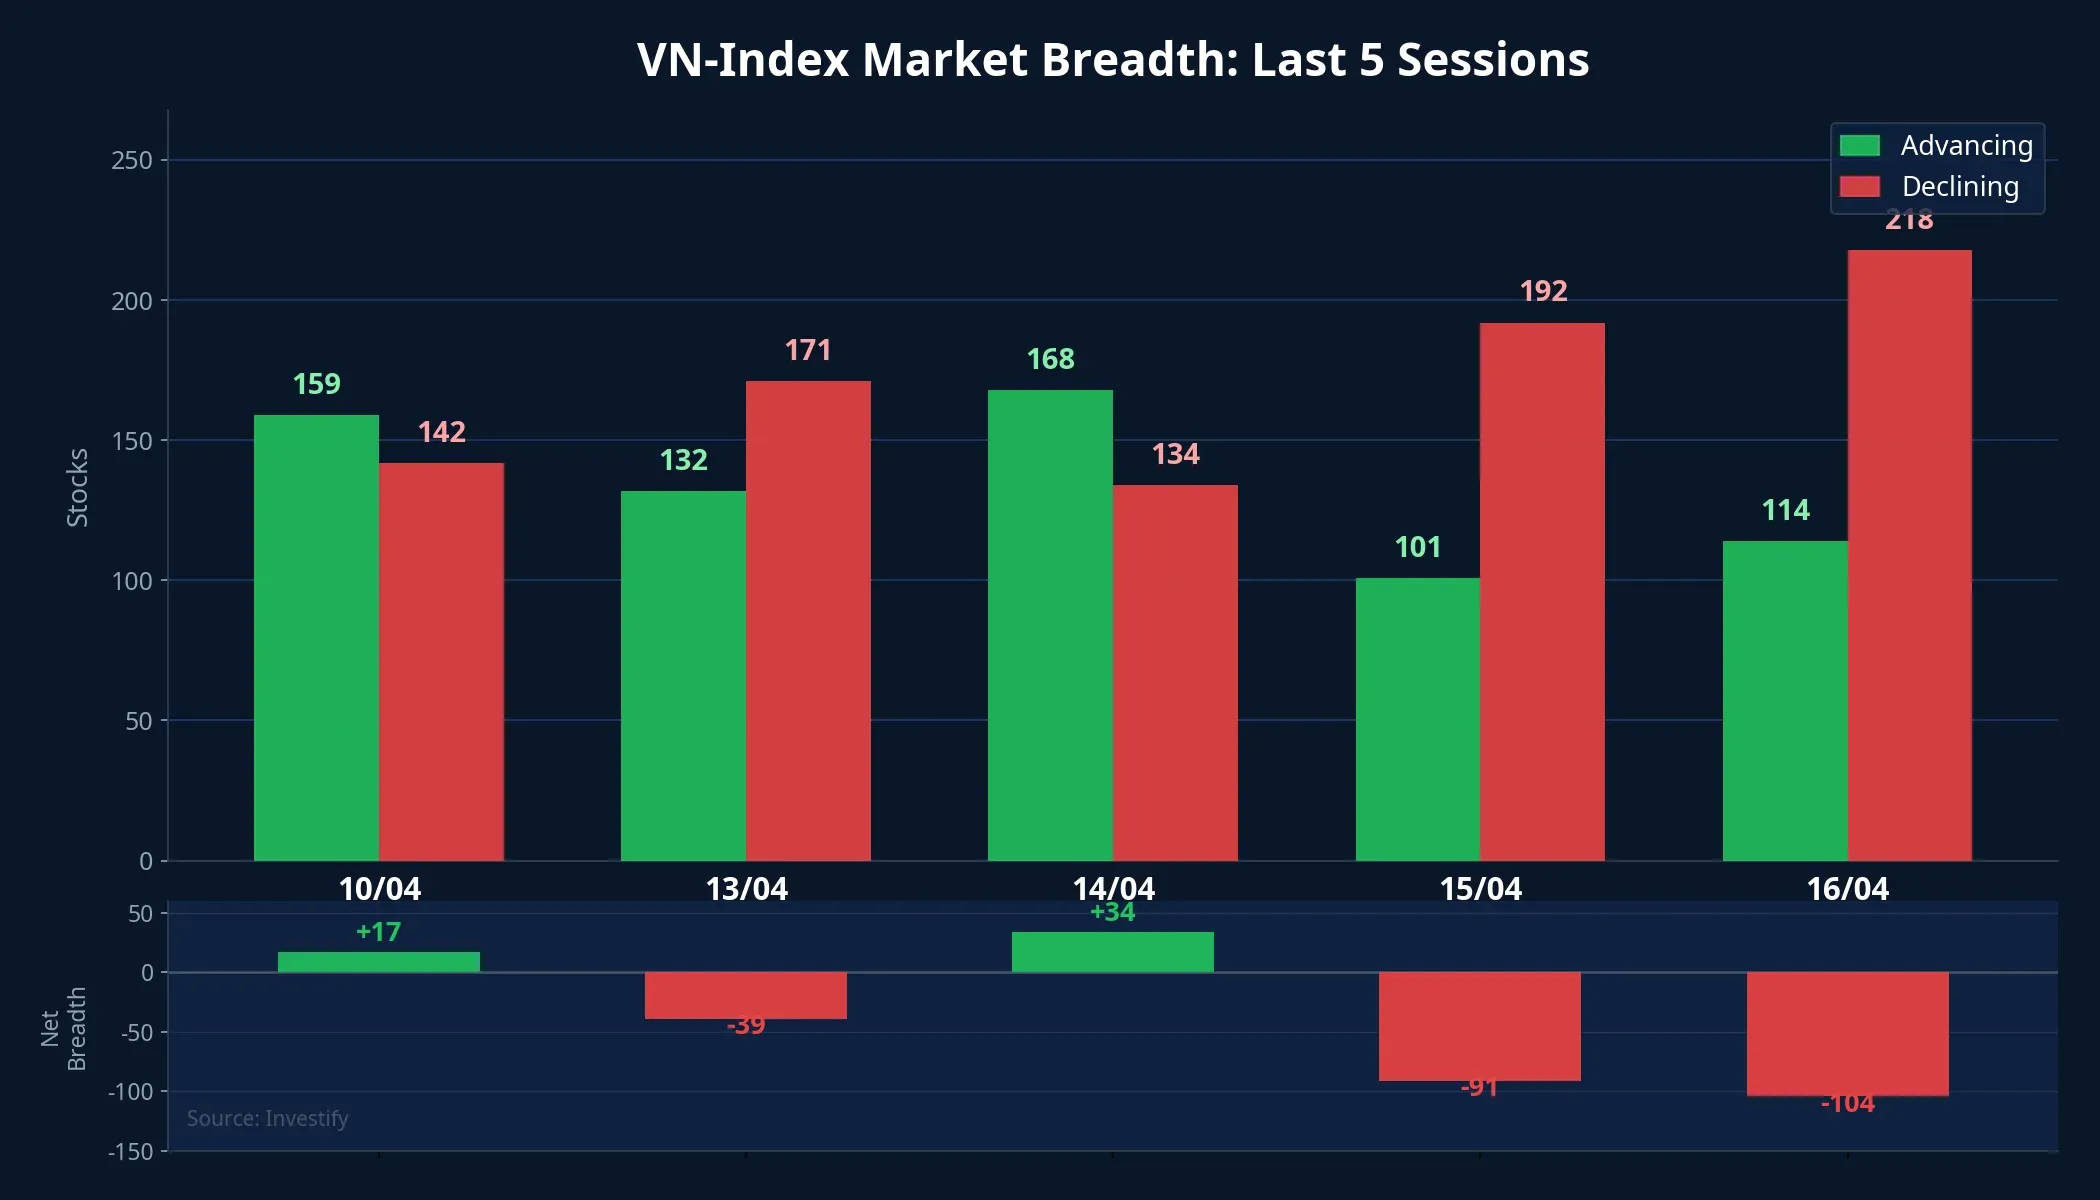
Layer 1: Narrow breadth — index green, most stocks red
On April 16, VN-Index gained 1.07% but only 114 stocks advanced versus 218 declining. This was no anomaly: the April 15 session rose 1.41% with just 101 advancers and 192 decliners. In other words, the index was green but over 60% of listed stocks were red.
The direct cause was VIC (Vingroup), which hit the 6.95% ceiling for two consecutive sessions on April 15-16, pushing its market cap to VND 1,458,800 trillion. VIC alone contributed the bulk of index points thanks to its heavy weighting. Meanwhile, VNFin (the financial sector, accounting for over 31% of market capitalization) dropped 0.49% in the same session.
This divergence persisted throughout April. VN30 (the top 30 large-caps) rose approximately 6.8% over the past month, but VNMidCap and VNSmallCap declined, showing the rally failed to spread to mid- and small-cap stocks. This is a key difference from Nikkei and KOSPI, where gains were distributed more broadly thanks to clear sector-level catalysts.
Layer 2: Foreign outflows, waiting for FTSE
While Nikkei and KOSPI attracted strong international capital, VN-Index saw the opposite trend. Foreign investors net sold approximately VND 4,164 billion in the first 16 sessions of April, concentrating sales in blue-chip names VHM, VIC, VCB, and BID.
In stark contrast, foreign investors at KOSPI net purchased KRW 5,377 trillion in April, with 90% concentrated in SK Hynix (KRW 2,873 trillion) and Samsung Electronics (KRW 1,961 trillion).Seoul Economic Daily In Japan, net foreign equity inflows have reached approximately JPY 13.5 trillion since Q2 2025.Nikkei Asia
Why is international capital not prioritizing Vietnam at this point? FTSE Russell has confirmed Vietnam’s upgrade to Emerging Market status, effective from September 21, 2026, with a four-phase transition through September 2027.FTSE Russell Estimated passive inflows from FTSE EM Index-tracking funds are approximately $500-600 million in the initial phase, potentially reaching $6 billion in total.VietnamPlus But the effective date is still five months away, and passive funds have no obligation to buy ahead of schedule.
Layer 3: Missing structural narrative, unfavorable sector composition
This is the deepest layer explaining the performance gap. Nikkei and KOSPI did not rally solely on risk-on sentiment; both had structural catalysts that VN-Index currently lacks.
Japan broke records thanks to three converging factors. First, a weak yen boosted export-oriented corporate earnings when converted to local currency, while making Japanese equities more attractive in USD terms for foreign investors. Second, corporate governance reforms mandated by the Tokyo Stock Exchange require companies to publicly disclose plans for improving capital efficiency, reducing cross-shareholdings, and enhancing capital allocation transparency.JPX Third, authorized share buybacks in 2024 exceeded JPY 18 trillion, nearly doubling from the prior year, with the trend continuing into 2025.Japan Times
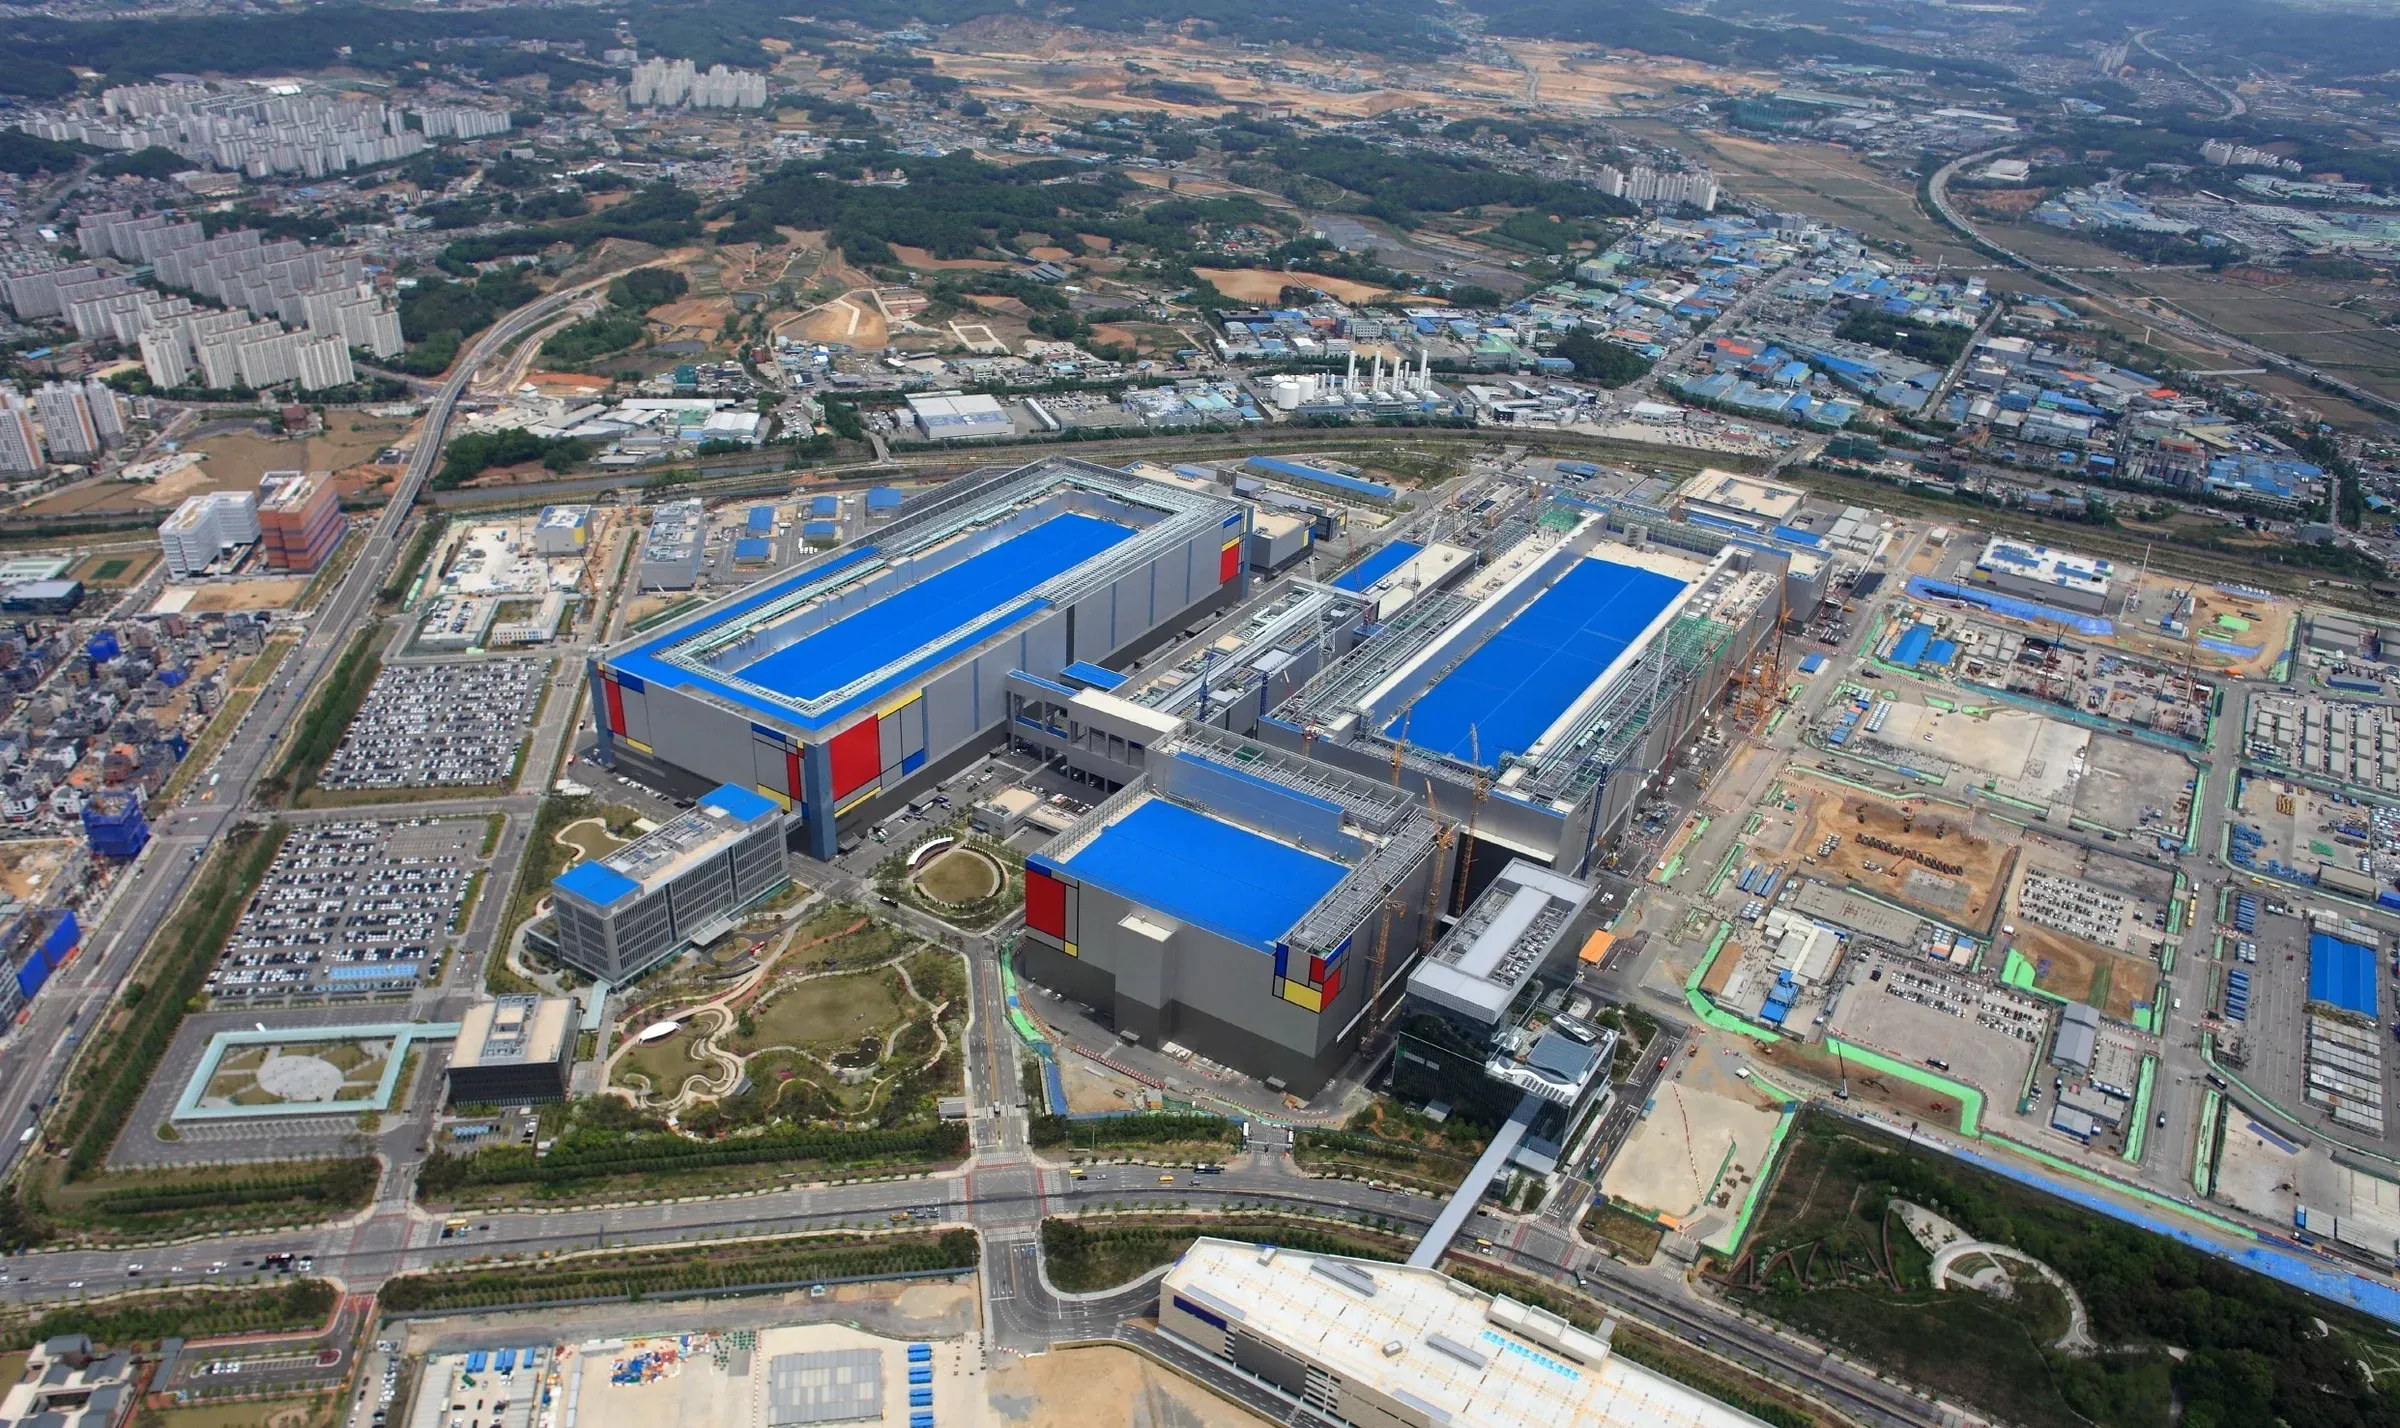
South Korea has its own clear narrative: the global semiconductor recovery cycle. SK Hynix hit an all-time high of KRW 1,103,000, with estimated Q1 operating profit exceeding KRW 40 trillion.Seoul Economic Daily Samsung Electronics surged 10% in a single session. These two stocks carry heavy KOSPI weighting and serve as “locomotives” similar to VIC in Vietnam, but backed by genuine earnings growth driven by global AI chip demand.
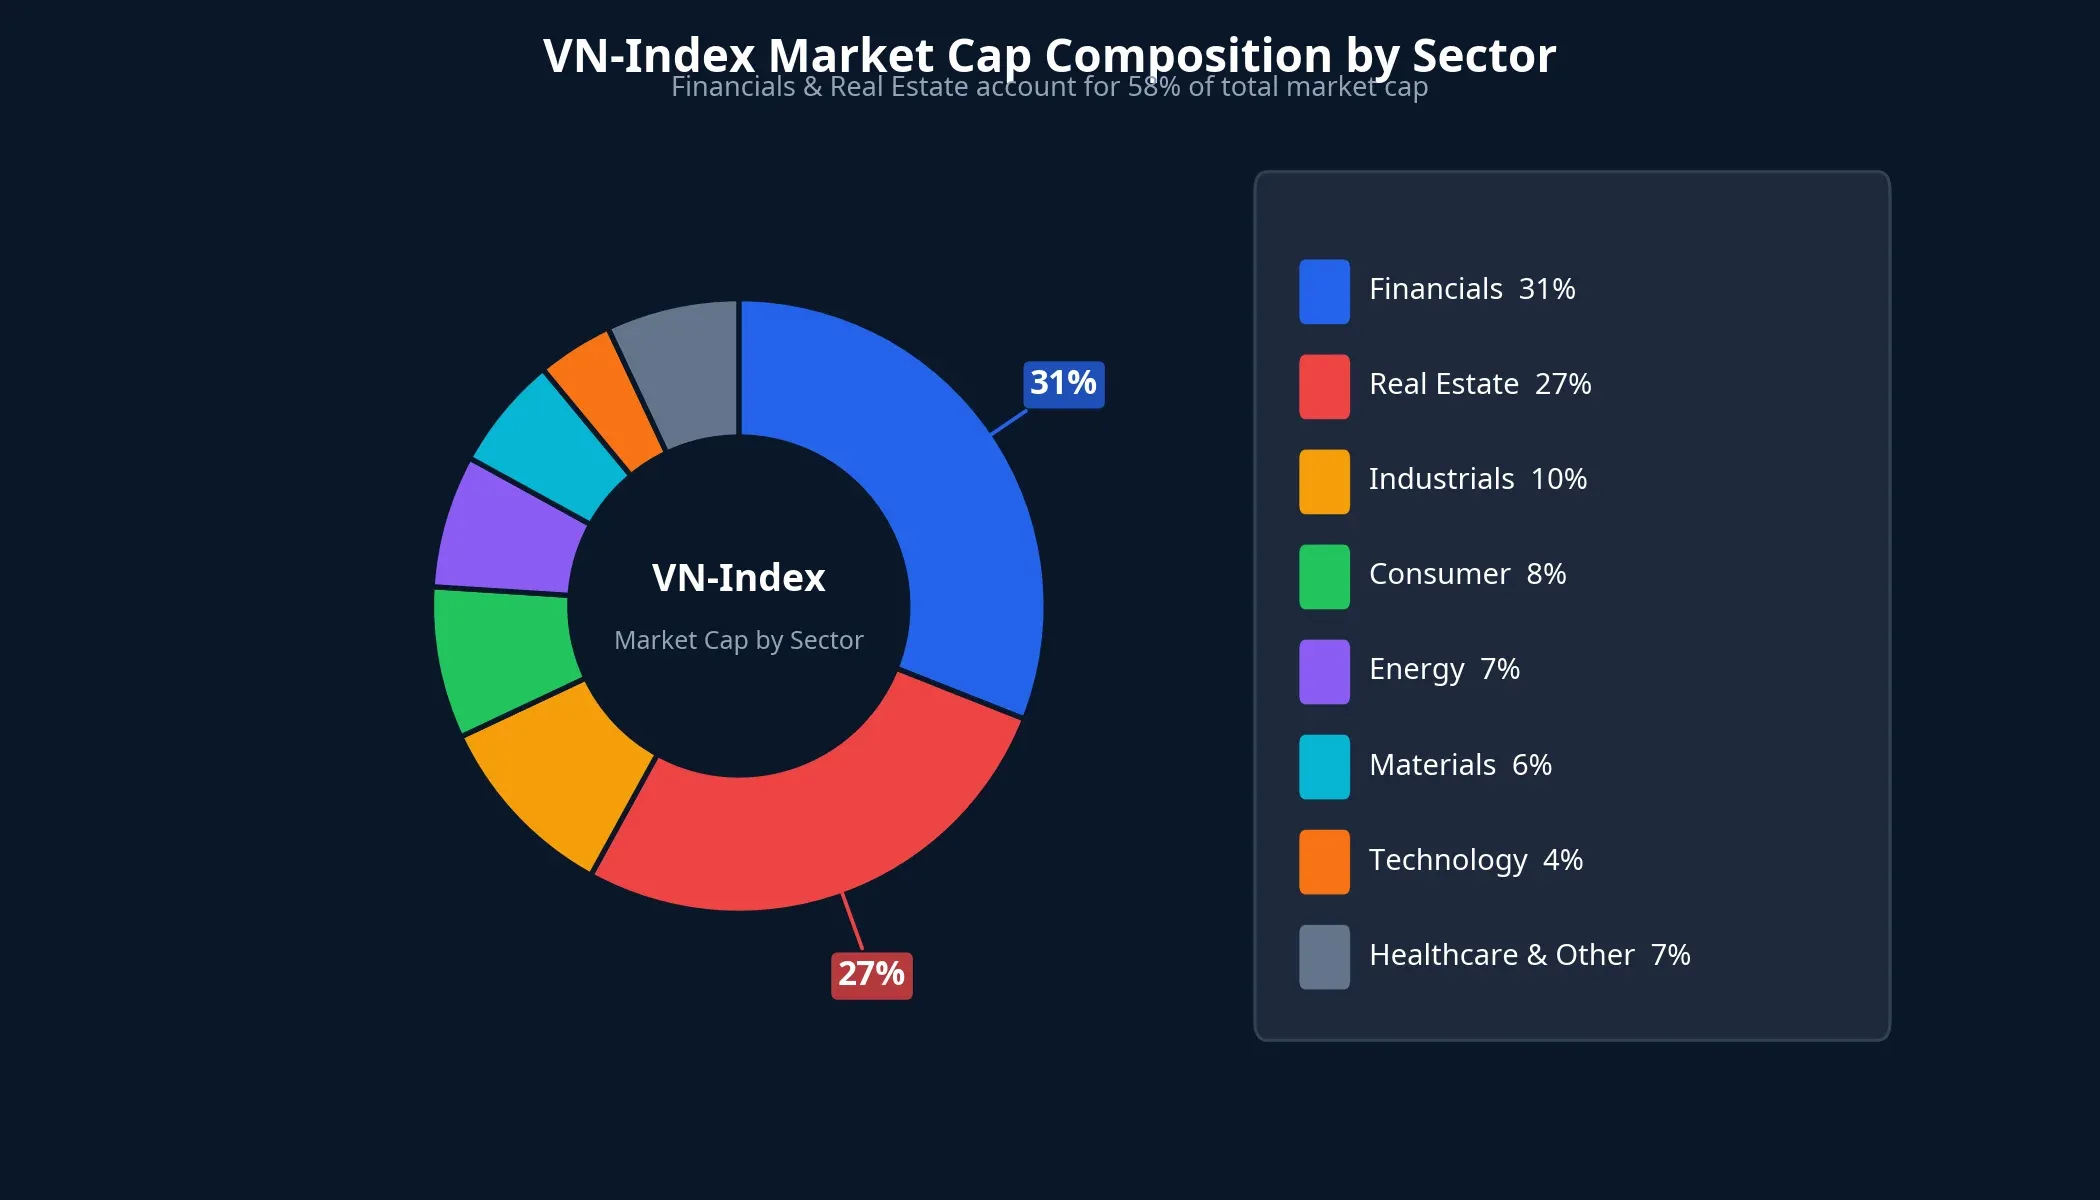
Vietnam has a highly concentrated sector composition: financials account for over 31% and real estate nearly 27% of market capitalization. When these two groups diverge, as on April 16 when VNREAL rose 4.94% but VNFIN fell 0.49%, the index struggles to rally strongly. More importantly, Vietnam lacks an equivalent structural narrative. The FTSE upgrade story takes effect in September with passive flows yet to arrive. The real estate recovery story, while positive, is cyclical and policy-dependent, not a global structural trend.
Outlook: three deciding factors
The big picture shows the performance gap between VN-Index and Nikkei/KOSPI reflects structural differences, not a signal that the Vietnamese market is weakening. A 7.5% monthly gain is significant, especially considering that just three weeks ago (March 23), the index dropped over 3.4% in a single session.
However, to narrow the gap, the market needs at least one of three catalysts:
First, the FTSE upgrade on September 21, 2026. As the date draws closer, front-running capital flows could begin in Q3 2026. This is the most significant catalyst but remains five months away.
Second, the Q1 2026 earnings season. Business results will reveal whether corporate earnings support current valuations. If growth proves strong, the market gains additional reasons for capital to rotate back into mid- and small-cap stocks.
Third, broadening breadth. If the rally spreads beyond Vingroup and real estate, the market becomes more sustainable. The April 8 session, with 297 advancers and just 25 decliners (+4.71%), demonstrated that when breadth expands, VN-Index can rally powerfully.
Key factors to watch next week: whether U.S.-Iran negotiation progress continues to support risk-on sentiment, and whether domestic capital flows spread beyond the VIC-real estate cluster. Q1 earnings season is approaching; that will be the real test of whether VN-Index can sustain its footing without depending on a handful of heavyweight stocks.