
Over the trading week of April 14-18, Wall Street climbed and VIX closed at 17.48 — a 32.7% drop in 30 days. A narrative is spreading fast across Vietnamese retail forums: “VIX at 17 means peak greed, the post-Hormuz rally is just a bull trap, sell on Monday”. The logic isn’t unreasonable — VIX below 13 did precede major tops in January 2018, December 2019, and November 2021.
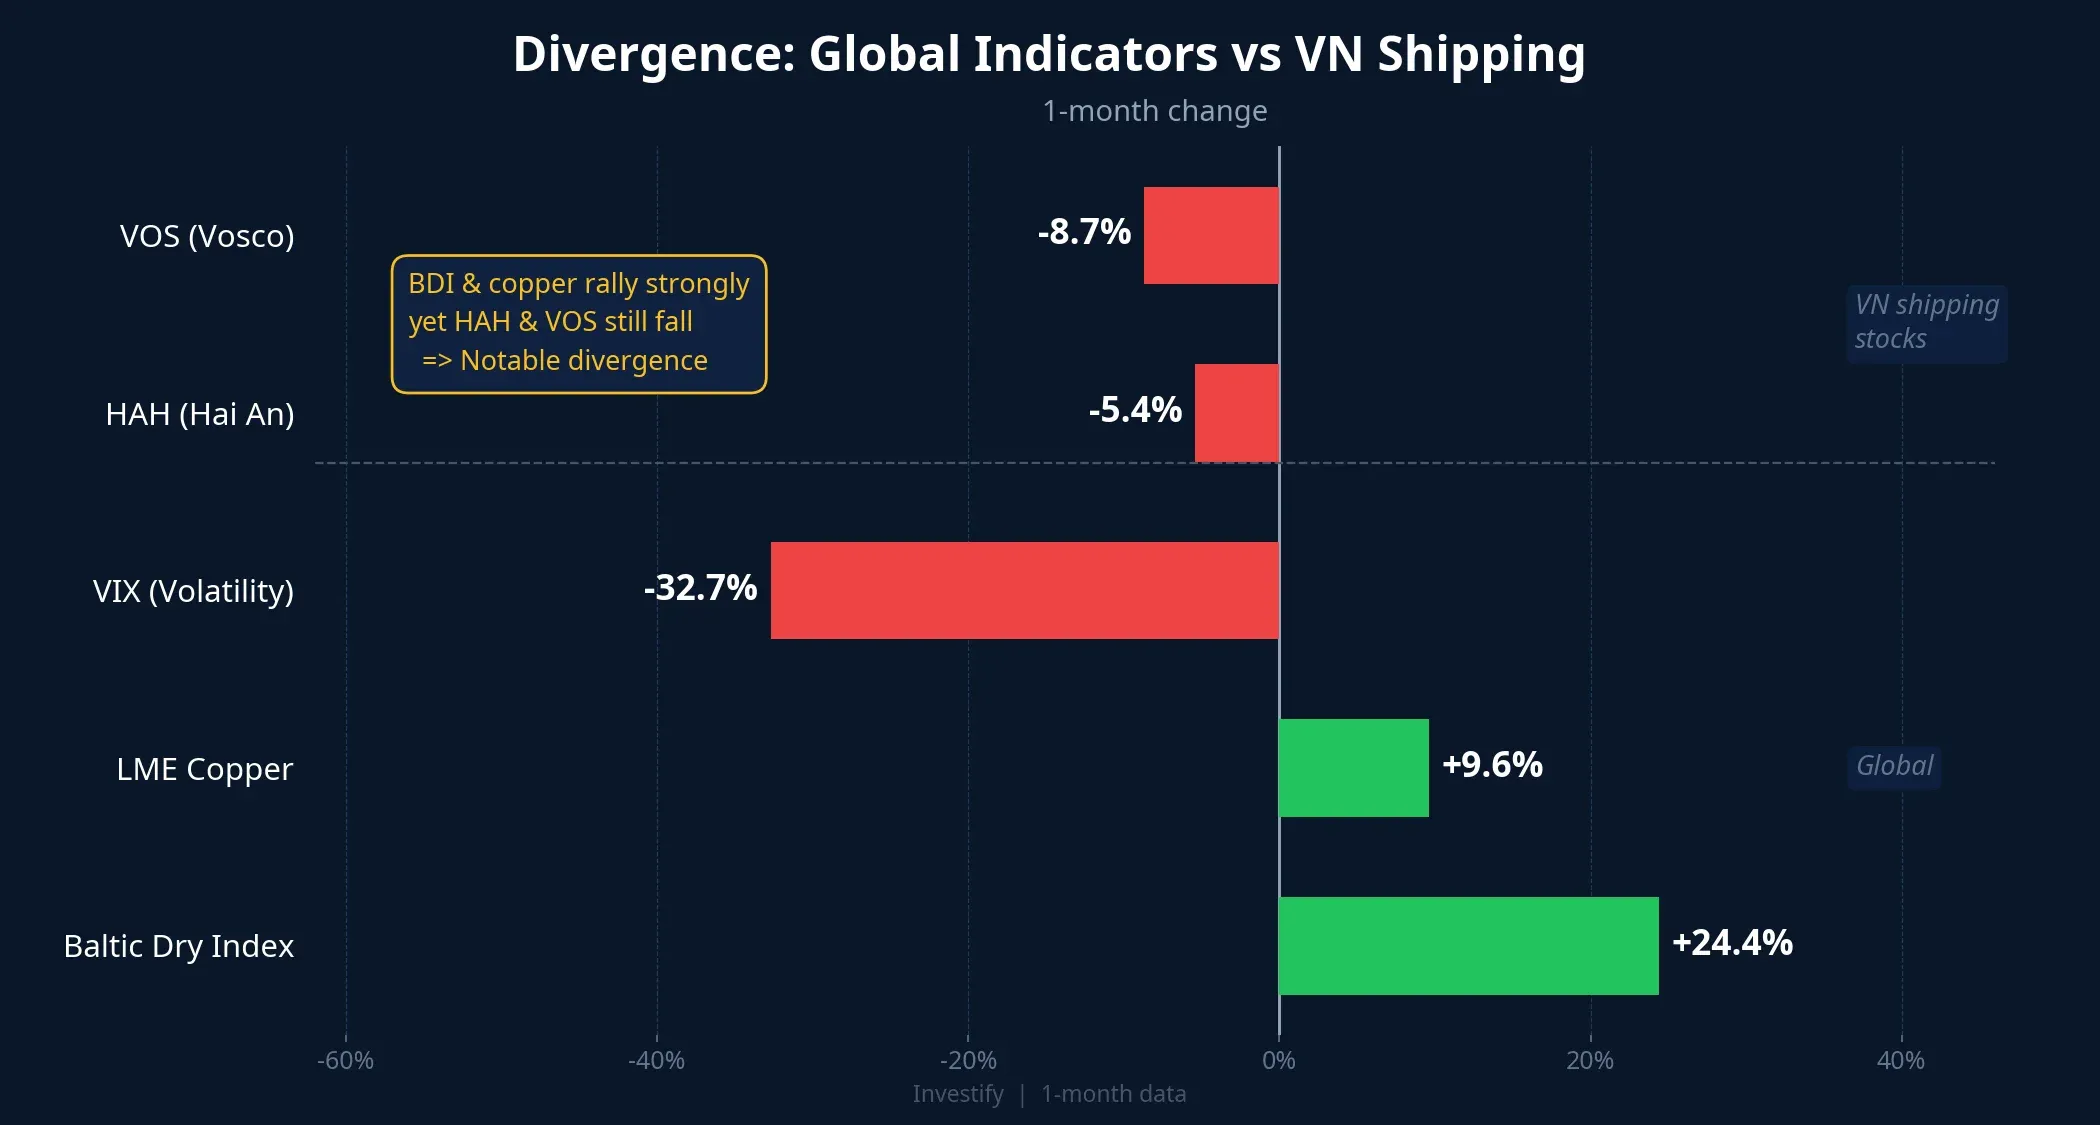
But reading the market through one sentiment indicator means missing two countervailing signals from the real economy: the Baltic Dry Index has just posted 11 consecutive up days to a 4-month high, while LME copper — up nearly 10% — carries an uncomfortable inventory paradox. Three indicators, three independent sources, three answers — far messier than a clean “bull trap” or “bull rally” story.
Indicator 1: VIX at 17.48 is low, but not the yearly low
First, a distinction that matters: VIX at 17.48 is not the 12-month low. The actual trough over the past year is 13.47 — recorded on December 24, 2025, meaning the market was meaningfully calmer earlier in the year than it is today.
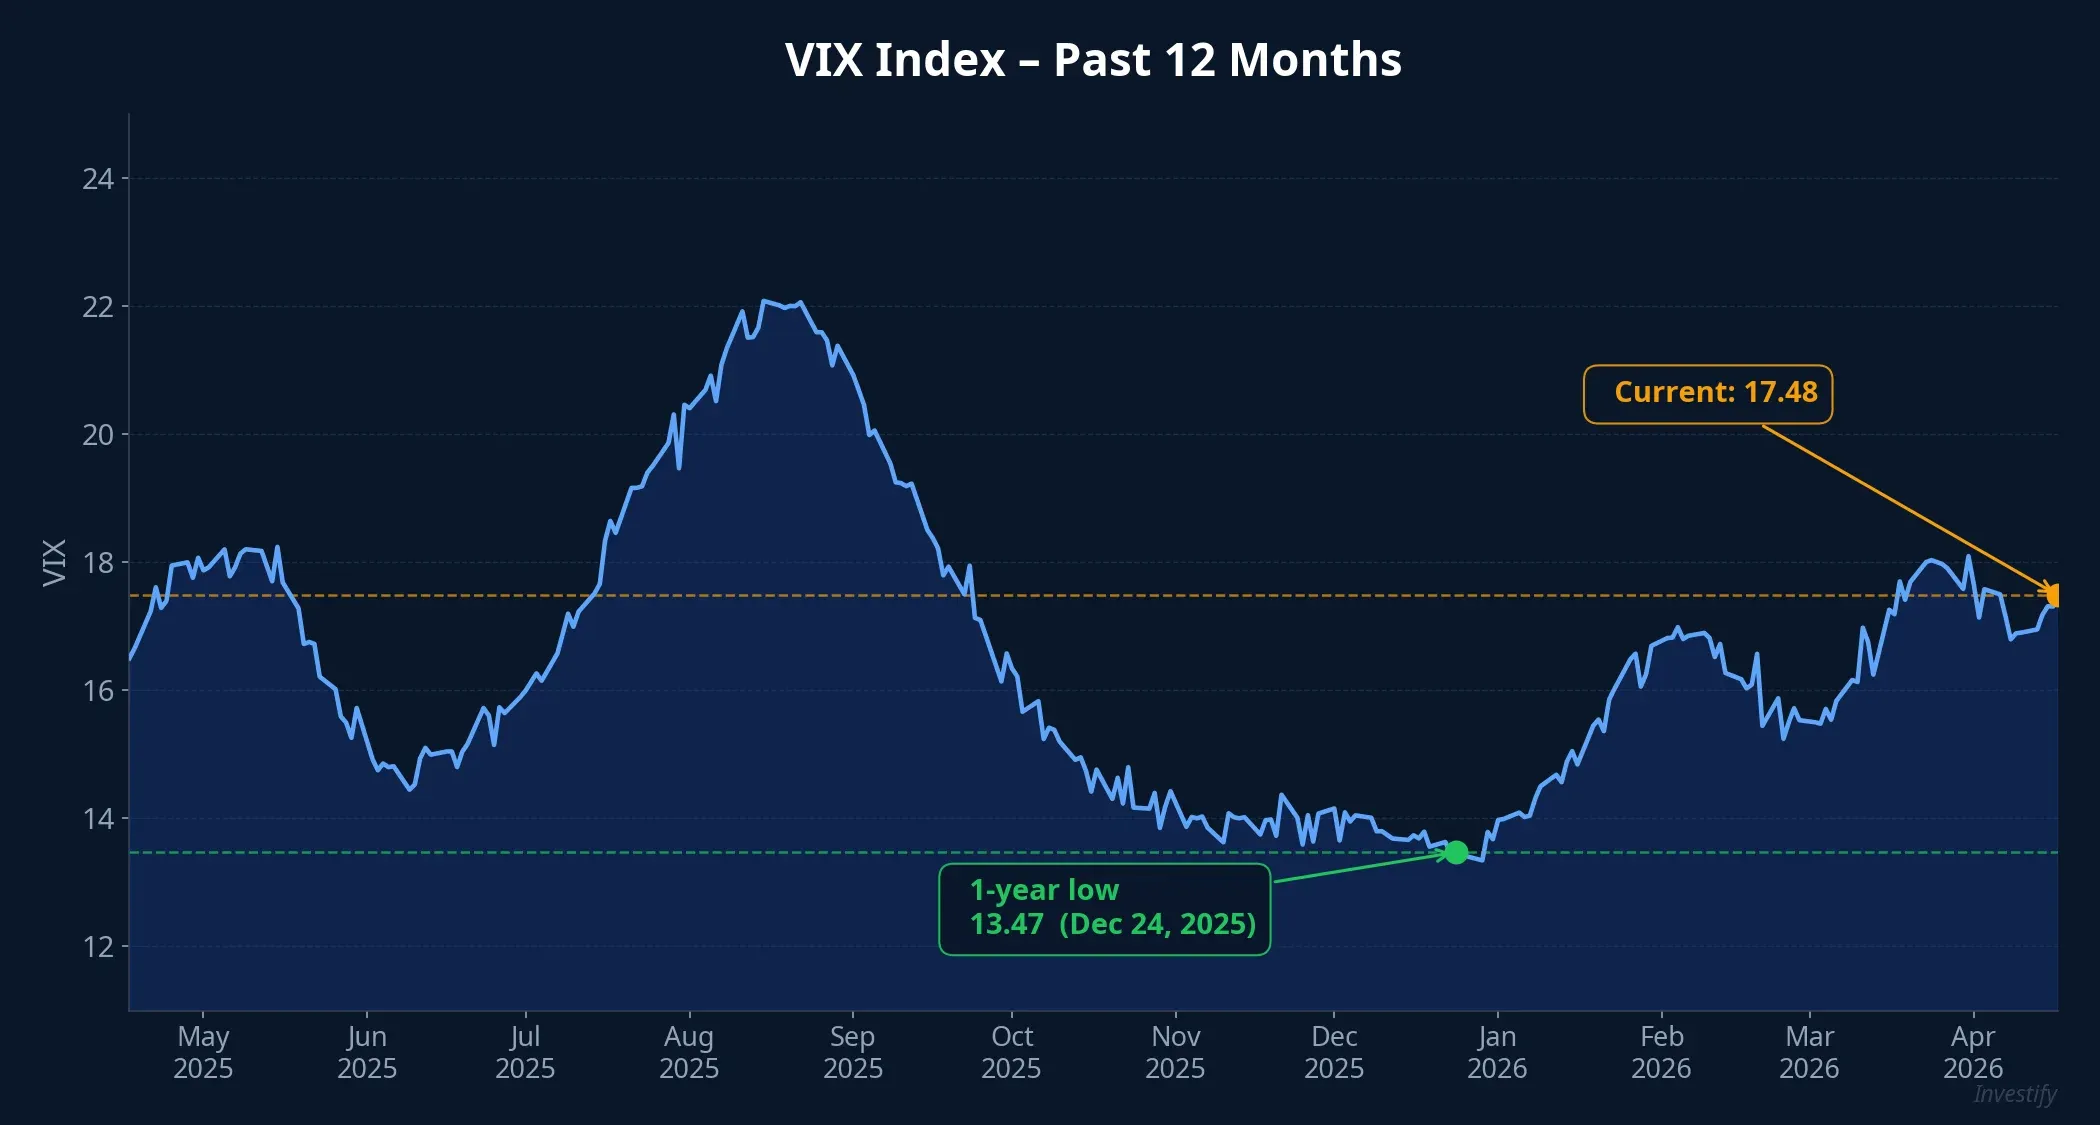
The chart shows VIX sitting between the truly quiet zone (13-14) and the summer panic peak (22+). Sentiment has recovered strongly after the Hormuz shock, but it hasn’t yet entered the “complacency” zone typically seen before major tops.
For a macro strategist, this means calling the current moment “peak greed” is premature. We need two more vantage points to check whether the market is leading itself with sentiment, or with real money flow.
Indicator 2: Baltic Dry at 2,567 — the 11th consecutive up day
This is the hardest of the three indicators to manipulate. Each point on the Baltic Dry Index reflects the actual price exporters and importers are paying to charter dry-bulk vessels — there’s no derivative sentiment layer.
On April 17, BDI closed at 2,567 points, up 1.7% on the day — the 11th consecutive rising session, pushing the index to a 4-month high.TradingEconomics For the week, the index gained 16.6%, and over 30 days it’s up 24.4%. Notably, the Capesize segment — the largest vessels, used for iron ore and coal — rose 2.5% to 4,128 points, also a multi-month high.
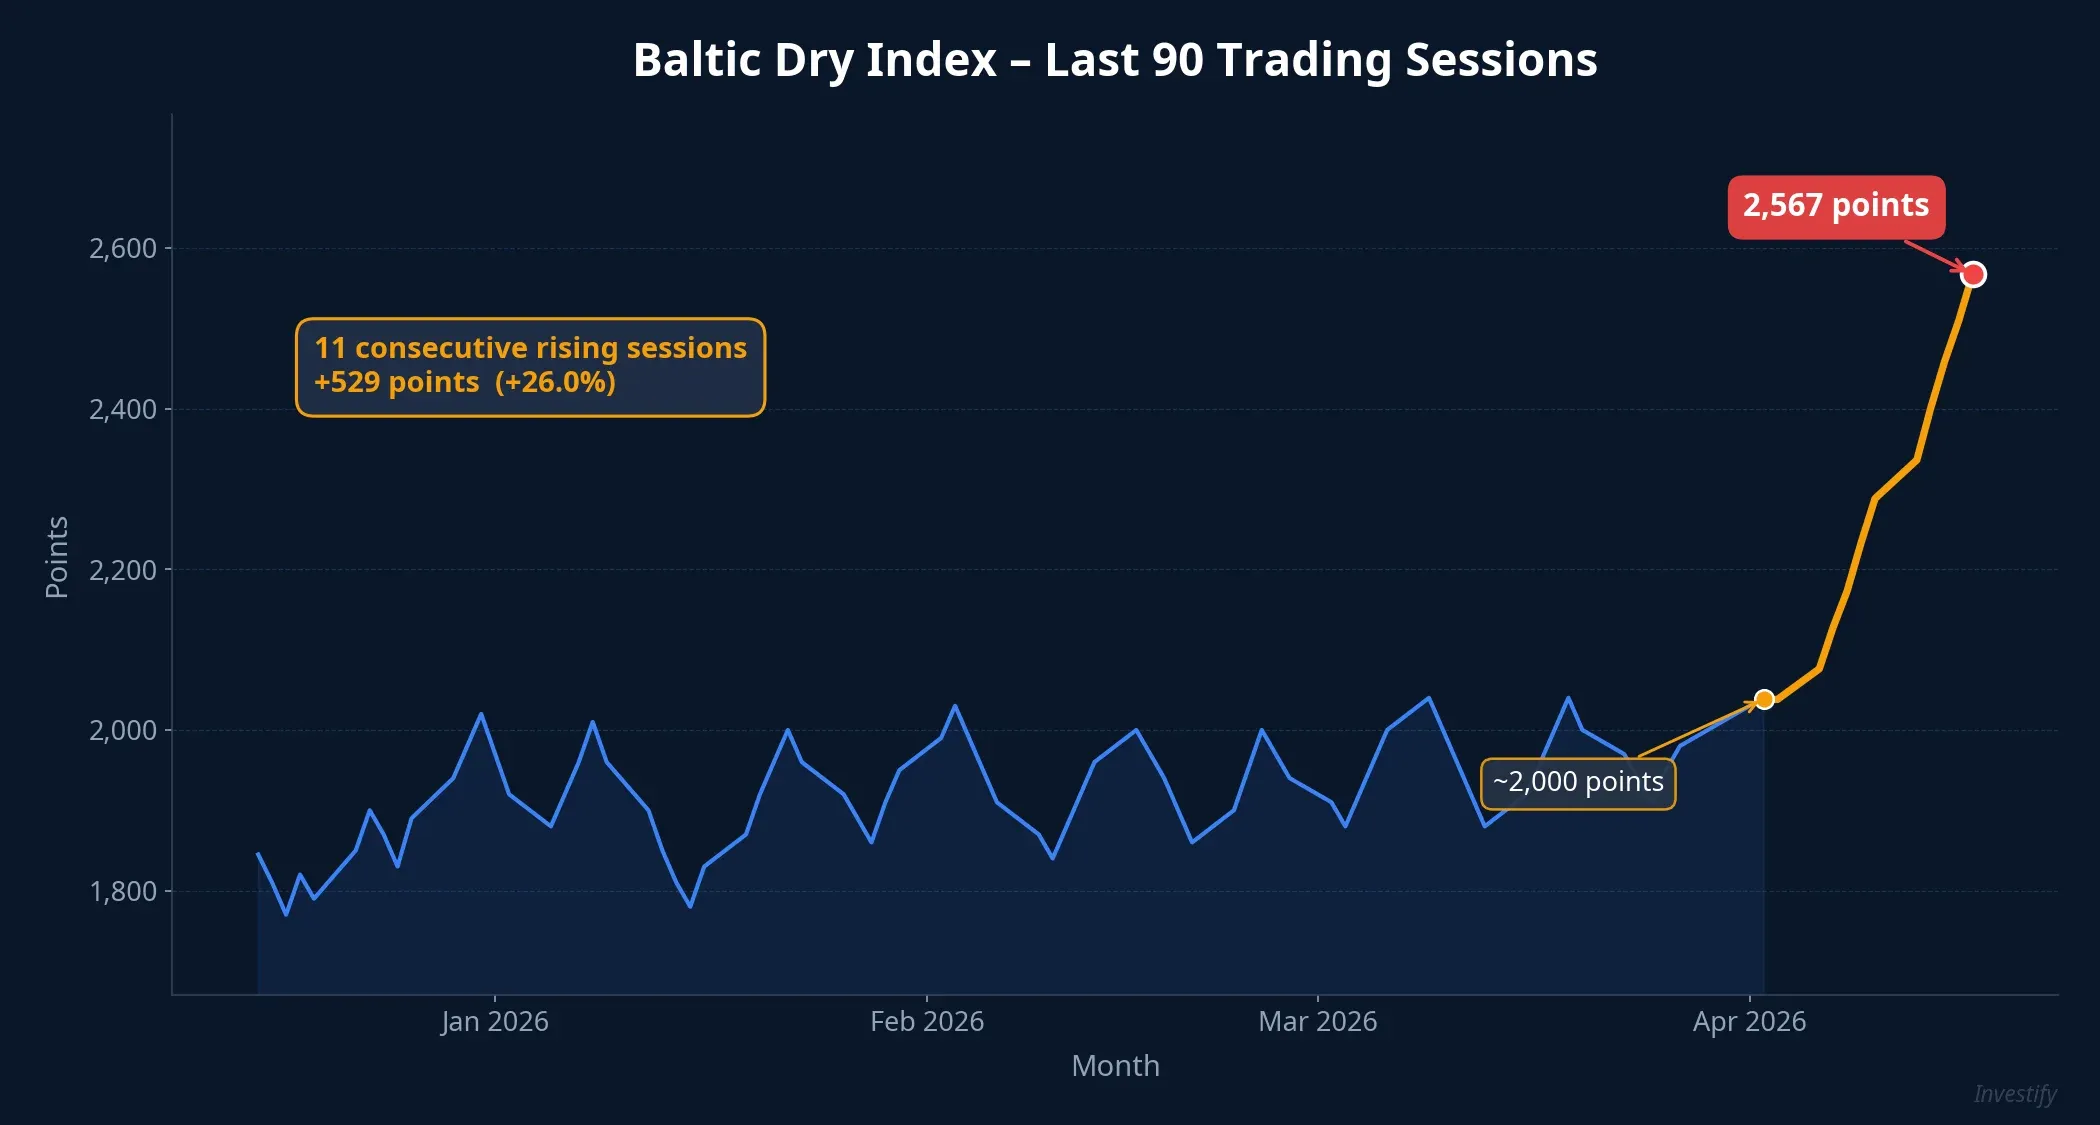
The rally is driven by three parallel sources: metallurgical coal (Russia pulling back offers, China and India stepping up imports, CFR prices pushing to 150-160 USD/ton), grain flows (high logistics costs keeping Panamax/Handysize demand tight), and iron ore on long-haul routes from Brazil/Australia to Asia. When BDI rises for 11 consecutive sessions and touches a multi-month high, physical shipping demand is exceeding vessel supply — a signal that typically leads export data by 4-6 weeks.
Indicator 3: LME copper at 6,087 USD/ton, with cracks
LME copper traded around 6,087 USD/ton on April 17, up 9.6% over 30 days. Combined with Baltic Dry, the industrial-commodity picture seems to be warming in unison. But here’s where honesty matters: copper does not fully confirm a “trade cycle breakout” narrative.
Three cracks stand out. The Yangshan copper premium — the physical premium Chinese importers pay above LME — fell to around 34 USD/ton by mid-March 2026,SMM very low compared to sustained copper uptrends (typically above 80 USD/ton). According to Investify data updated more recently, the premium has recovered to around 65 USD/ton — less bad, but not yet confirming full Chinese physical demand return.
LME inventory, meanwhile, has climbed to an 8-year high, with global copper stocks exceeding 1.39 million tons — the highest in nearly two decades.FinancialContent As a rule, sustained copper rallies coincide with falling inventory, not rising inventory — price up and stocks up is a signal that copper is being re-priced partly by non-demand factors.
That non-demand factor may be a weaker dollar: DXY has dropped to 98.24,TradingEconomics making USD-priced commodities automatically more attractive to buyers outside the dollar bloc. Part of copper’s move is FX mechanics, not genuine industrial demand.
The consolidated picture: a real cycle, but uneven
When the three indicators are placed side by side, the conclusion sits between the “bull trap” and “all-in” extremes:
| Indicator | Source | Reading |
|---|---|---|
| VIX 17.48 | US derivative sentiment | Fear gone, not yet extreme complacency |
| Baltic Dry 2,567 | Physical shipping | Real dry-bulk demand warming, especially coal and grain |
| Copper 6,087 USD/t | Industrial metals | Partly FX-driven; LME inventory at record high |
Physical trade is genuinely warming, a weak dollar supports commodities, but global industrial demand remains uneven. This is an orderly re-pricing, not a synchronized bull rally.
Vietnam: three sectors worth watching, one divergence to track
VN-Index finished the week at 1,817.17 points, up roughly 67 points on the week. If the global trade cycle is confirming (however unevenly), money flow is worth watching along three lines.
Shipping stocks present a striking divergence. HAH currently trades at 55,000 VND and VOS at 13,050 VND. Over 1 month: HAH is down 5.4%, VOS down 8.7% — Vietnamese shippers moving opposite to global BDI.
This divergence typically has a 4-8 week lag: if BDI holds above 2,500, Vietnamese shipping names historically respond. But it’s important to separate dry-bulk shipping (direct BDI exposure) from container shipping (driven by SCFI, a different cycle).
Dry-commodity exports — rice, agricultural goods — benefit doubly when commodity prices rise alongside shipping costs. Industrial metals deserve more caution: copper up doesn’t mean steel up, with iron-ore stocks at Chinese ports still elevated and HRC steel roughly flat this past week. The copper picture already has cracks, so expecting it to drag the entire metals complex higher is too simple.
Three divergence signals to watch over the next 2-4 weeks
To know whether the trade cycle is genuinely confirming — or simply a temporary re-pricing — these three signals will give a clearer answer than VIX alone:
- LME copper inventory: if it starts falling from the 8-year peak, the bull case for industrial metals firms up meaningfully. If it keeps rising, copper prices are running ahead of the data and correction risk is high.
- Yangshan premium: holding above 80 USD/ton signals genuine Chinese demand return. Stuck in the 60-65 USD range means the physical market is still hesitating.
- Baltic Dry holding above 2,500: if BDI corrects sharply the moment VIX ticks back up, that’s a sign the recent rally was mostly short covering, not durable physical demand.
Bottom line
The popular “VIX 17 = peak greed = bull trap” belief reads the market through a single sentiment indicator, and VIX 17.48 itself is not even the 12-month low. Cross-checked against Baltic Dry’s 11-session winning streak and LME copper’s 9.6% gain alongside record-high inventory, the picture is more nuanced: global trade is genuinely warming but unevenly, with clear cracks on the metals inventory side. The three divergence signals above — LME stocks, Yangshan premium, BDI holding 2,500 — will provide a much clearer answer over the next 2-4 weeks, before Q2 earnings begin.